


Application performance monitoring
Monitor your application performance with Zabbix

Your Mendix application is likely monitored by system monitoring tools to guard its availability and performance. But are you curious how many orders are created in your application? How many calls it makes to your SAP system? How many users are logged in? So are you curious what is going inside your application?
Why not collect and export such (business) data to Zabbix to create a dashboard with graphs showing your application performance?
Terminology
Before you continue, let’s make a few terms clear:
- metric
- a thing that you want to collect data (measurements) of, for example the amount of open orders
- is defined in Zabbix as a trapper item
- measurement
- a value and timestamp related to a single metric, for example 45 open orders at 17 Nov 2017 10:26
- is collected by your Mendix application and pushed to the right metric in Zabbix
What is Zabbix?
Zabbix is a monitoring platform which monitors operating systems, storage systems, networks and applications. As it allows you to define your own monitoring templates you can add your own metrics to it.
Where do I get it?
In case you do not have a Zabbix environment available or you want to test this integration in a separate environment, download a ready-to-go virtual machine here: Zabbix Appliance. I use VirtualBox therefore I download the Open virtualization format (.ovf) image. Have a look here for details like accounts to access the VM.
For this blog I used Zabbix version 3.4.
How to push measurements?
Zabbix has an API called Zabbix sender protocol. The standard Zabbix installation provides a command line tool called zabbix-sender, which can be used to push measurements from shell scripts into Zabbix. But that does not work for a Mendix application.
GitHub user hengyunabc created a Java library that does the job. I have wrapped it in a Mendix Java action to push measurements from my Mendix application into Zabbix.
For this blog the version for the Java library was 0.0.5.
Prepare to retrieve measurements
When you want to create your own metrics in Zabbix you have to add trapper items manually. Have a look here how to do this. The Zabbix server syncs configuration from the database every CacheUpdateFrequency seconds. By default, this setting is 60 seconds, but it may have been changed for your installation. So it takes this amount of time before the new trapper becomes available.
For each metric that you need you have to create a single trapper. It sounds like a lot of work but it’s pretty easy. You will spend more time thinking about what to monitor and define sound names for the trappers than actually creating them.
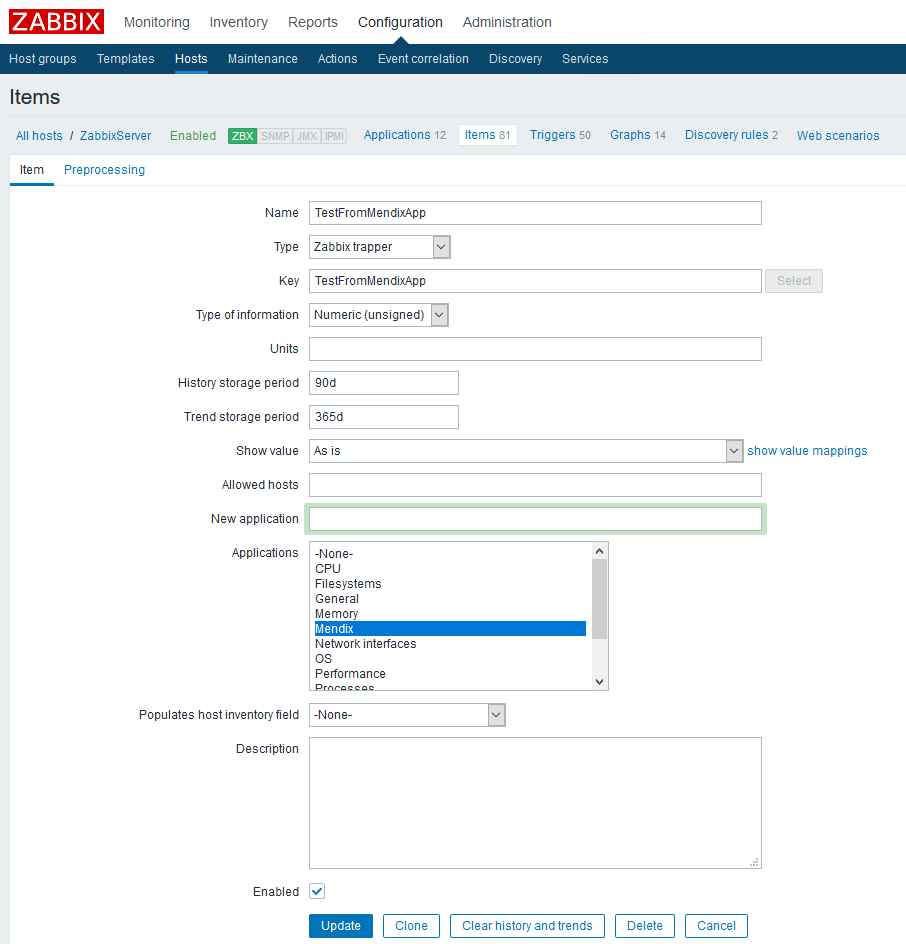
The screenshot above shows what my trapper item looks like.
Mendix Java action
First a disclaimer and some notes about my Java code:
- I am not a Java developer and there’s some trial and error and googling needed to get what I want.
- I use log statements a lot where the Mendix log node is provided by the Mendix application and is not hard coded. This helps to manage the amount of log nodes in your application and it should be a standard practice for all Mendix AppStore code.
- Logging is prefixed by a UUID to help you group the records in the log in case this action is called in parallel and the log lines are mixing up.
- There’s some error handling in there, but exception handling requires attention by a real Java developer.
You will find the Java action below. It requires these libraries (all can be found at the Maven Central Repository) that you put in the userlib folder of your Mendix application:
- fastjson-1.2.39.jar
- slf4j-nop-1.7.25.jar
- zabbix-sender-0.0.5.jar
// This file was generated by Mendix Modeler.
//
// WARNING: Only the following code will be retained when actions are regenerated:
// - the import list
// - the code between BEGIN USER CODE and END USER CODE
// - the code between BEGIN EXTRA CODE and END EXTRA CODE
// Other code you write will be lost the next time you deploy the project.
// Special characters, e.g., é, ö, à , etc. are supported in comments.
package zabbix.actions;
import java.math.BigDecimal;
import com.mendix.core.Core;
import com.mendix.systemwideinterfaces.core.IContext;
import com.mendix.webui.CustomJavaAction;
import io.github.hengyunabc.zabbix.sender.*;
import zabbix.proxies.SendMeasurementToZabbixResult;
import zabbix.proxies.Server;
import zabbix.proxies.Trapper;
import com.mendix.systemwideinterfaces.core.IMendixObject;
public class SendMeasurementToZabbix extends CustomJavaAction<IMendixObject>
{
private IMendixObject __MeasurementParameter1;
private zabbix.proxies.Measurement MeasurementParameter1;
private java.lang.String LogNode;
public SendMeasurementToZabbix(IContext context, IMendixObject MeasurementParameter1, java.lang.String LogNode)
{
super(context);
this.__MeasurementParameter1 = MeasurementParameter1;
this.LogNode = LogNode;
}
@Override
public IMendixObject executeAction() throws Exception
{
this.MeasurementParameter1 = __MeasurementParameter1 == null ? null : zabbix.proxies.Measurement.initialize(getContext(), __MeasurementParameter1);
// BEGIN USER CODE
String logkey = "Java " + java.util.UUID.randomUUID() + ": ";
Core.getLogger(this.LogNode).debug(logkey + "start");
try
{
// Initialize the return object
SendMeasurementToZabbixResult returnobject= new SendMeasurementToZabbixResult(getContext());
// Retrieve the Trapper object
Trapper zabbixTrapper = this.MeasurementParameter1.getMeasurement_Trapper();
if (zabbixTrapper == null) {
Core.getLogger(this.LogNode).error(logkey + "Could not find associated trapper object; failed");
returnobject.setSuccess(false);
return returnobject.getMendixObject();
}
// Retrieve the Server object
Server zabbixServer = zabbixTrapper.getTrapper_Server();
if (zabbixServer == null) {
Core.getLogger(this.LogNode).error(logkey + "Could not find associated server object via trapper object; failed");
returnobject.setSuccess(false);
return returnobject.getMendixObject();
}
// Initialize the sending process
String host = zabbixServer.getHost();
int port = zabbixServer.getPort();
ZabbixSender zabbixSender = new ZabbixSender(host, port);
// Store values in data object which is send to Zabbix
DataObject dataObject = new DataObject();
dataObject.setHost(zabbixTrapper.getHost());
dataObject.setKey(zabbixTrapper.getKey());
dataObject.setValue(this.MeasurementParameter1.getValue());
dataObject.setClock(this.MeasurementParameter1.getTimestamp().getTime()/1000); // TimeUnit is SECONDS
Core.getLogger(this.LogNode).debug(logkey + "Zabbix server = " + zabbixServer.getDisplayText());
Core.getLogger(this.LogNode).debug(logkey + "Zabbix trapper = " + zabbixTrapper.getDisplayText());
Core.getLogger(this.LogNode).debug(logkey + "Application measurement = " + dataObject.getValue() + "/" + dataObject.getClock());
Core.getLogger(this.LogNode).debug(logkey + "data prepared, ready to call Zabbix");
// Send the data to Zabbix
SenderResult resultsend = zabbixSender.send(dataObject);
Core.getLogger(this.LogNode).debug(logkey + "called Zabbix");
// Interpret the result; is made available to the calling Mx app
returnobject.setSuccess(resultsend.success());
Core.getLogger(this.LogNode).debug(logkey + "result success = " + resultsend.success());
returnobject.setFailed(resultsend.getFailed());
Core.getLogger(this.LogNode).debug(logkey + "result failed = " + resultsend.getFailed());
returnobject.setProcessed(resultsend.getProcessed());
Core.getLogger(this.LogNode).debug(logkey + "result processed = " + resultsend.getProcessed());
returnobject.setSpentSeconds(new BigDecimal(resultsend.getSpentSeconds()));
Core.getLogger(this.LogNode).debug(logkey + "result time = " + resultsend.getSpentSeconds());
Core.getLogger(this.LogNode).debug(logkey + "finished ");
// Return the result
return returnobject.getMendixObject();
} catch (Exception e) {
throw new RuntimeException(logkey + "Failed - " + e.getMessage(), e);
}
// END USER CODE
}
/**
* Returns a string representation of this action
*/
@Override
public java.lang.String toString()
{
return "SendMeasurementToZabbix";
}
// BEGIN EXTRA CODE
// END EXTRA CODE
}
The action returns a SendMeasurementToZabbixResult object that contains the result of the call. This is what the entity looks like in my application:
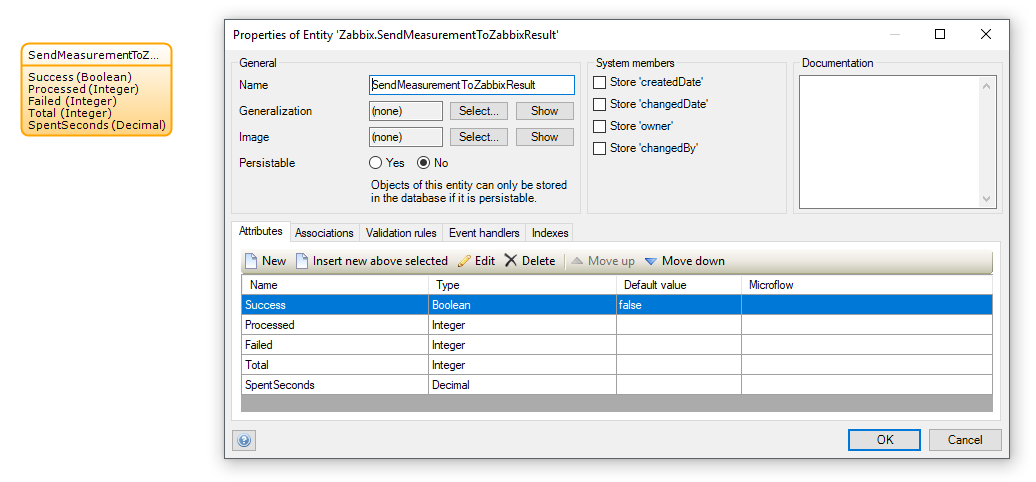
In the code above I allow a single measurement to be send to Zabbix, but the library allows sending a list of measurements. The SendMeasurementToZabbixResult entity is prepared for it, but I have not implemented this advanced use (yet).
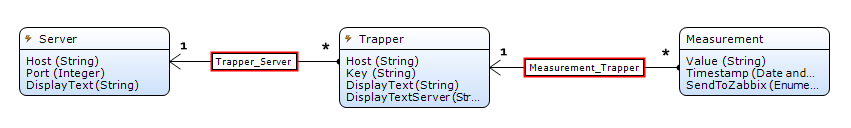
Mendix data model
In your Mendix application you have to make the following data available to ensure that you have the right information:
- definition of at least one Zabbix server
- hostname, so IP address or FQDN
- port number of the Zabbix server process, default 10051
- definition of at least one trapper item, related to a single Zabbix server
- monitored host as defined in Zabbix
- name of the trapper item
I created a simple data model that allows me to configure the servers and trappers dynamically and create measurements to be send by a scheduled event.
Demo application
I have created a demo application; download here, requires Mendix 6.10.10. It contains sample data to get you started but you have to customize it to your own situation (e.g. IP address of your Zabbix server) and need (e.g. name of the host and trapper).
This demo has some of my best practices that I would like to draw your attention to.
The scheduled events SendMeasurementsToZabbix and CleanupMeasurements are limited in the number of measurements the process in each run. This is never an issue with a small amount of measurements, but when you grow and the amount of measurements grows it will help to prevent issues. It is up to you, but it’s one of my best practices to protect my application; what if some process gets in a loop and millions of measurements are created…
Microflow MC_Measurement_Create_Uncommitted creates a new measurement. Never put Create actions for the same entity at multiple places in your application, just create a single microflow to do that to enforce quality and prevent (future) mistakes.
Microflows MC_Server_CreateWhenMissing and MC_Trapper_CreateWhenMissing are called from the after startup microflow(s). When your application requires runtime configuration data to function, then provision this runtime data automatically. Especially when this data is defined by a developer and not by an application administrator.
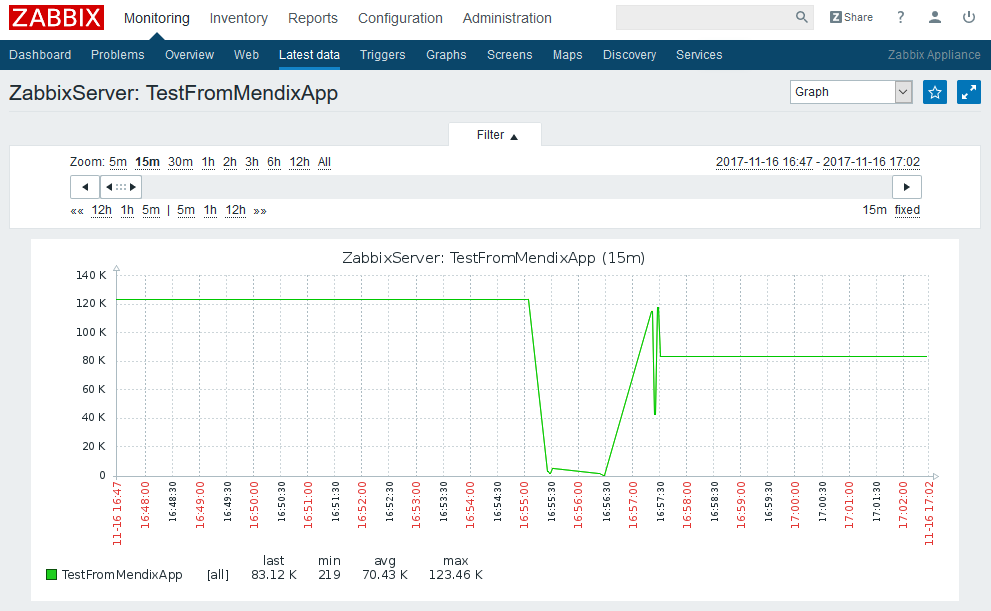
What does it look like in Zabbix?
The demo application has a function to create random measurements for a specific trapper. I have used that function to generate some measurements and send them to Zabbix (via the scheduled event). See the screenshot below what the result looks like in the Zabbix interface.
I hope you learned something here and that it inspires you to do fun stuff.
Share this post
Twitter
Facebook
Reddit
LinkedIn
StumbleUpon
Pinterest
Email